Report on Government Services 2025
PART G: LATEST UPDATE: 10 JUNE 2025
G Housing and homelessness
Data downloads
These data tables relate to the sector as a whole. Data specific to individual service areas is in the data tables under the relevant service area.
- Housing and Homelessness sector overview data tables (XLSX 72.5 KB)
- Housing and Homelessness sector overview dataset (CSV 84.1 KB)
Refer to the Sector overview text and corresponding table number in the data tables for detailed definitions, caveats, footnotes and data source(s).
Note: Data tables are referenced by table xA.1, xA.2, etc, with x referring to the sector or overview. For example, table GA.1 refers to data table one for this sector overview.
- Housing and Homelessness – sector overview and sections (PDF 4.1 MB) Current as at 30/01/2025
- Guide: How to find what you need in RoGS (PDF 288.5 KB)
Main aims of services within the sector
The housing and homelessness sector provides services that support access to affordable, safe and sustainable housing for all Australians – a vital determinant of wellbeing that is associated with better outcomes in health, education and employment, as well as economic and social participation (CSERC 2015). The main service outputs are:
- Provision of subsidised rental housing to assist low income people who are unable to access suitable housing options in the private market
- Provision of direct assistance to people who are homeless or at risk of homelessness, to support them to achieve and maintain housing and economic participation.
Housing
Subsidised rental housing is provided by not-for-profit, non-government or government organisations.
- Total state and territory government net recurrent expenditure on social housing was $5.4 billion in 2023-24, an increase of $0.4 billion from 2022-23. This expenditure included $4.1 billion for public housing and $343.8 million for State owned and managed Indigenous housing (SOMIH).
- Nationally, at 30 June 2024, there were 450,551 social housing dwellings (tenancy rental units for community housing) and 425,519 households accessing social housing.

Homelessness services
Government specialist homelessness services provide direct assistance for people who are homeless or at risk of homelessness, including accommodation and other services such as health, counselling, education and employment services.
- Total government recurrent expenditure on specialist homelessness services was $1.5 billion in 2023-24, or $56.44 per person in the population.
- Nationally in 2021, 48.2 Australians per 10,000 in the population were homeless on Census night, a total of 122,494 people.
- The number of clients with accommodation and services other than accommodation needs that were met in 2023‑24 was 272,689.
Detailed information on the equity, effectiveness and efficiency of service provision and the achievement of outcomes for the social housing and specialist homelessness services areas is contained in the service-specific sections.
Government expenditure in the sector
Total government funding for social housing and specialist homelessness services was around $6.9 billion in 2023‑24. For the 2022-23 financial year (the most recent financial year for which data is available across all sections), this represented around 1.7% of total government expenditure covered in this report.
Australian government funding of $1.9 billion was provided to state and territory governments through the National Housing and Homelessness Agreement and related agreements in 2023-24.
Flows in the sector
Paths into and through the housing and homelessness services sector vary widely (figure G.1). Drivers of housing instability include market factors affecting affordability and household factors such as adverse personal, social, and economic circumstances.
Figure G.1 Role of housing and homelessness sector services in pathways to secure housing
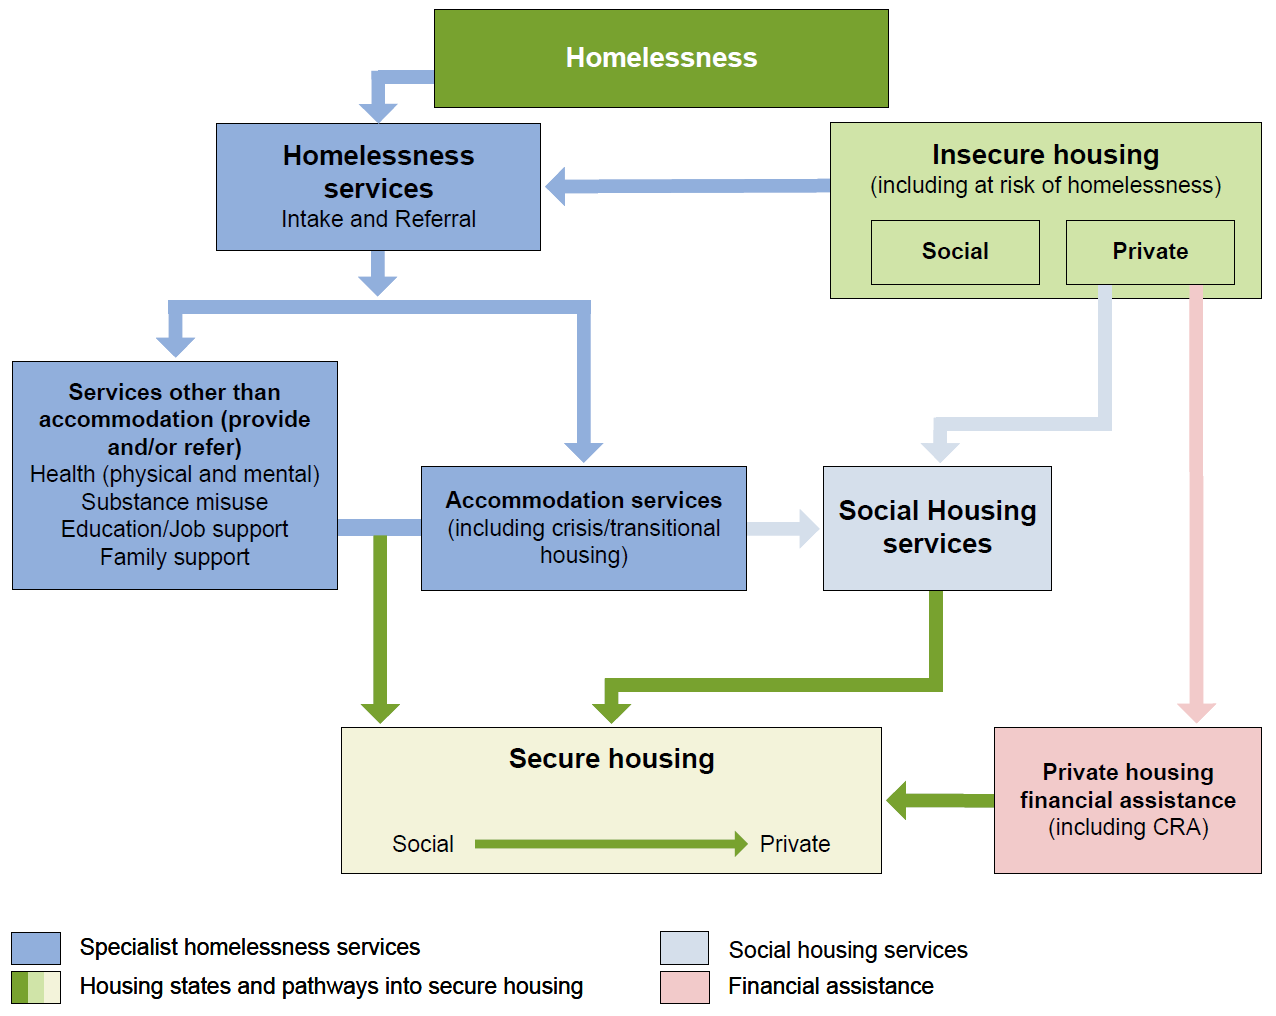
Commonwealth Rent Assistance (CRA)
Governments also provide private rental assistance and home purchase assistance as targeted payments to assist access to private housing and reduce demand on social housing and homelessness services.
Commonwealth Rent Assistance (CRA) is the largest government rental assistance program:
- Expenditure on the program in 2023-24 was $5.5 billion dollars (table GA.4)
- At end June 2024, 72.6% of low income households would have experienced rental stress without CRA, though 41.8% of low income households receiving CRA still experienced rental stress over the period (table GA.12).
Low income earners are particularly susceptible to housing instability as market factors lead to higher private housing prices. ‘Rental stress’ – spending more than 30% of gross household income on rent – is a measure of housing affordability for this cohort. In 2019-20 52.5% of lower income households renting in the private sector were paying more than 30% of gross household income on housing costs (table GA.2).
A summary of the social housing and specialist homelessness services performance indicator results is presented. Detailed information is in the service-specific sections.
- Nearly all housing across social housing types was occupied by low-income households at end June 2024
- 99.9% (public housing), 99.7% (SOMIH) and 99.6% (community housing). These figures have remained relatively stable over the past 3 years.
- Few public housing and SOMIH households were facing rental stress at end June 2024
- 0.5% of public housing, 0.3% of SOMIH and 6.5% of community housing households were in rental stress at end June 2024.
- In 2023-24 new social housing allocations were successfully targeted to those in greatest need1
- 87.4% (public housing), 81.2% (SOMIH) and 79.9% (community housing).
- The time waited for public housing in 2023-24 was similar to 2022-23
- 50% of newly allocated households in public housing were allocated a dwelling within nine months (as in 2022-23); 75% were allocated a dwelling within 35 months (up from 32 months in 2022-23). For SOMIH in 2023-24, 50% of newly allocated households were allocated a dwelling within 11 months; 75% were allocated a dwelling within 53 months.
More information: section 18 Housing
- Greatest need households are defined as households that at the time of allocation are homeless, in housing inappropriate to their needs, in housing that is adversely affecting their health or placing their life and safety at risk, or, have very high rental housing costs.
- Most homelessness services clients needed assistance with accommodation in 2023-24
- Over half (54.1%) of clients with closed support periods needed accommodation or accommodation related assistance. Of these clients, 63.4% were directly provided with and/or referred for a service, up from 61.2% in 2022-23.
- Nationally, most clients at risk of homelessness avoided homelessness in 2023-24
- Of all clients at risk of homelessness, 80.9% avoided homelessness. For Aboriginal and Torres Strait Islander clients at risk of homelessness, 79% avoided homelessness.
- Some clients experienced a return to homelessness or persistent homelessness
- The proportion of clients who returned to homelessness after achieving housing was at a 5 year national low of 10.3% in 2023-24
- Of all clients who experienced homelessness nationally in 2023-24, 26.3% experienced persistent homelessness (that is, were homeless for more than seven months over the 24 month reporting period).
More information: section 19 Homelessness services
We value your comments about this publication and encourage you to provide feedback.