Report on Government Services 2025
PART B, SECTION 4: LATEST UPDATE: 10 JUNE 2025
4 School education
LATEST UPDATE 10 JUNE 2025:
Indicator results for:
Student outcomes (national testing), NAP Civics and Citizenship 2024 data
Context on:
This section focuses on performance information for government-funded school education in Australia.
The Indicator results tab uses data from the data tables to provide information on the performance for each indicator in the Indicator framework. The same data is also available in CSV format.
Data downloads
![]() 4 School education data tables (XLSX 1.0 MB)
4 School education data tables (XLSX 1.0 MB)
![]() 4 School education dataset (CSV 3.8 MB)
4 School education dataset (CSV 3.8 MB)
Refer to the corresponding table number in the data tables for detailed definitions, caveats, footnotes and data source(s).
Objectives for school education
Australian schooling aims for all young Australians to become successful lifelong learners, confident and creative individuals, and active and informed members of the community positioning them to transition to further study or work and successful lives. It aims for students to improve academic achievement and excel by international standards.
To meet this vision, the school education system aims to:
- engage all students and promote student participation
- deliver high quality teaching of a world-class curriculum in a sustainable manner.
Governments aim for school education services to meet these objectives in an equitable and efficient manner.
The vision and objectives align with the educational goals in the Alice Springs (Mparntwe) Education Declaration (EC 2019) and the National School Reform Agreement (NSRA) (COAG 2018).
Schooling aims to provide education for all young people. The structure of primary and secondary schooling is the same across all states and territories in Australia.
Compulsory school education
Entry to school education is compulsory for all children in all states and territories. The child age entry requirements are subject to specific legislation within each state and territory (ABS 2025). In 2024, minimum starting ages generally restricted enrolment to children aged between four-and-a-half and five years at the beginning of the year (ABS 2025). (Refer to section 3, for more details.)
National mandatory requirements for schooling – as agreed in the National Youth Participation Requirement (NYPR) – came into effect through relevant state and territory government legislation in 2010. Under the NYPR, all young people must participate in schooling until they complete Year 10; and if they have completed Year 10, participate in full-time education, training or employment (or combination of these) until 17 years of age (COAG 2009). Some state and territory governments have extended these requirements for their jurisdiction.
Type and level of school education
Schools are the institutions within which organised school education takes place (a definition of ‘school’ is in the ‘Explanatory material’ tab) and are differentiated by the type and level of education they provide:
- Primary schools provide education from the first year of primary school – known as the ‘foundation year’ in the Australian Curriculum (the naming conventions used in each state and territory is included under ‘foundation year (pre-Year 1)’ in the ‘Explanatory material’ tab). Since 2023, the structure of primary schooling is the same across all states and territories in Australia from pre-Year 1 to Year 6. Prior to 2022, primary school education was to Year 7 in South Australia, and prior to 2015 was to Year 7 in Queensland and Western Australia.
- Secondary schools provide education from Year 7 to Year 12 in all states and territories in Australia.
- Special schools provide education for students with one or more of the following characteristics: mental or physical disability or impairment; slow learning ability; social or emotional problems; or in custody, on remand or in hospital (ABS 2025).
Affiliation, ownership and management
Schools can also be differentiated by their affiliation, ownership and management, which are presented as two broad categories:
- Government schools are owned and managed by state and territory governments
- Non-government schools, including Catholic and independent schools, are owned and managed by non‑government establishments.
State and territory governments are responsible for ensuring the delivery and regulation of schooling to all children of school age in their jurisdiction. State and territory governments provide most of the school education funding in Australia, which is administered under their own legislation. They determine curricula, register schools, regulate school activities and are directly responsible for the administration of government schools. They also provide support services used by both government and non-government schools. Non-government schools operate under conditions determined by state and territory government registration authorities.
From 1 January 2018, the Australian Government introduced the Quality Schools package replacing the Students First funding model which had been in effect since 1 January 2014. More information on these funding arrangements can be found under ‘Interpreting efficiency data’ in the ‘Explanatory material’ tab.
The Australian Government and state and territory governments work together to progress and implement national policy priorities, such as: a national curriculum; national statistics and reporting; national testing; and teaching standards (PM&C 2014).
Nationally in 2022-23, government recurrent expenditure on school education was $85.9 billion, a 4.4% real increase from 2021-22 (table 4A.1). State and territory governments provided the majority of funding (68.5%) (figure 4.1).
Government schools accounted for $64.8 billion (75.4%), with state and territory governments the major funding source ($54.4 billion, or 84.0% of government schools’ funding). Non‑government schools accounted for $21.2 billion (24.6%), with the Australian Government the major funding source ($16.7 billion, or 79.0% of non‑government schools funding) (table 4A.1).
The share of government funding to government and non-government schools varies across jurisdictions and over time according to jurisdictional approaches to funding schools (more details are under ‘Interpreting efficiency data’ in the ‘Explanatory material’ tab) and is affected by certain characteristics, such as school structure and student body in each state and territory.
This report presents expenditure related to government funding only, not the full cost to the community of providing school education. Caution should be taken when comparing expenditure data for government and non‑government schools, because governments provide only part of school funding. Governments provided 60.8% of non‑government school funding in 2023, with the remaining 39.2% sourced from private fees and fundraising (Australian Government Department of Education unpublished).
Nominal Australian, state and territory government recurrent expenditure on school education is in table 4A.2. Data on Australian Government payments for school education services is in table 4A.3 and total government recurrent expenditure on government schools by school level is in table 4A.4.
Schools
In 2024, there were 9,653 schools in Australia (6,234 primary schools, 1,457 secondary schools, 1,431 combined schools and 531 special schools) (table 4A.5). The majority of schools were government owned and managed (69.7%).
Settlement patterns (population dispersion), age distribution of the population and educational policy influence the distribution of school size and level in different jurisdictions. Data on school size and level are available from Schools, 2024 (ABS 2025).
Staff
In 2024, there were 490,547 active full-time equivalent (FTE) staff in schools in Australia (51.2% working in primary schools and 48.8% in secondary schools). The majority of active staff were engaged in duties in government schools (61.5%) (table 4A.6).
Nationally in 2024, there were 320,377 FTE teaching staff, an increase of 2.8% from 2023. Of these 50.6% were teaching in primary schools and 49.4% in secondary schools (ABS 2025).
Student body
There were 4.1 million FTE students enrolled in school nationally in 2024, a 1.1% increase compared with 2023 (table 4A.7). Student enrolments were in:
- Government schools – 2.6 million FTE students enrolled (63.4% of all FTE students). This proportion has decreased from a peak of 65.7% in 2018 and 2019, and is the lowest in the last 10 years of data reported
- Non-government schools – 1.5 million FTE students enrolled (36.6% of all FTE students)
The proportion of FTE students enrolled in government schools is higher for primary schools (68.2%) than secondary schools (57.4%) (table 4A.7).
A higher proportion of FTE students were enrolled in primary schools (55.0%) than in secondary schools (45.0%) (table 4A.7). The Northern Territory had the highest proportion of FTE students enrolled in primary school education (58.7%).
The participation rate is typically close to 100% for Australian children aged 15 years (consistent with requirements under the NYPR) but decreases as age increases. Nationally in 2024, the school participation rate was 96.4% for Australian children aged 15 years (down from 99.3% in 2018) (table 4A.8). In 2024, the rate decreased to 90.3% of 16‑year-olds and 79.5% of 17-year-olds. Data for school participation rates for 15–19-year-olds by single year of age and totals are in table 4A.8.
Nationally, government schools had a higher proportion of students from selected equity groups than non‑government schools, including for:
- Aboriginal and Torres Strait Islander students – 8.5% of government school students and 3.4% of non-government school students in 2024 (table 4A.9)
- students from a low socio-educational background – 31.3% of government school students and 13.5% of non‑government school students in 2023 (table 4A.10)
- geographically remote and very remote students – 2.3% of government school students and 0.9% of non‑government school students in 2023 (table 4A.11).
In 2024, students with disability at government (27.2%), Catholic (23.0%) and independent schools (23.4%) received an education adjustment due to disability (table 4A.12). Data by level of adjustment is in table 4A.12.
The student to teaching staff ratio for all schools in 2024 was 12.9 students to one teacher, down from 13.1 students to one teacher in 2023 (tables 4A.13–14). The student to teaching staff ratio was lower in non-government schools than government schools at 12.5 and 13.1 students to one teacher, respectively.
Government secondary schools had a lower student to teacher ratio (12.2 students to one teacher) compared to primary schools (13.8 students to one teacher) (table 4A.14). This reflects different requirements for particular student groups, and for different school subjects in secondary schools.
School and Vocational Education and Training (VET)
School-aged people may participate in VET by either participating in ‘VET in Schools’, or (refer to section 5) remain engaged in education through a Registered Training Organisation (RTO). Nationally in 2023, there were 252,105 VET in Schools students, up by 3.8% since 2022 (NCVER 2024). Overall, 26.8% of people aged 15–19 years successfully completed at least one unit of competency as part of a VET qualification at the Australian Qualifications Framework (AQF) Certificate level II or above (at a school or RTO) in 2023 (table 4A.15).
The performance indicator framework provides information on equity, efficiency and effectiveness, and distinguishes the outputs and outcomes of School education.
The performance indicator framework shows which data is complete and comparable in this report. For data that are not considered directly comparable, text includes relevant caveats and supporting commentary. Section 1 discusses data comparability and completeness from a report-wide perspective. In addition to the contextual information for this service area (refer to Context tab), the report's statistical context (Section 2) contains data that may assist in interpreting the performance indicators presented in this section.
Improvements to performance reporting for School education are ongoing and include identifying data sources to fill gaps in reporting for performance indicators and measures, and improving the comparability and completeness of data.
Outputs
Outputs are the services delivered (while outcomes are the impact of these services on the status of an individual or group) (refer to section 1). Output information is also critical for equitable, efficient and effective management of government services.
Outcomes
Outcomes are the impact of services on the status of an individual or group (refer to section 1).
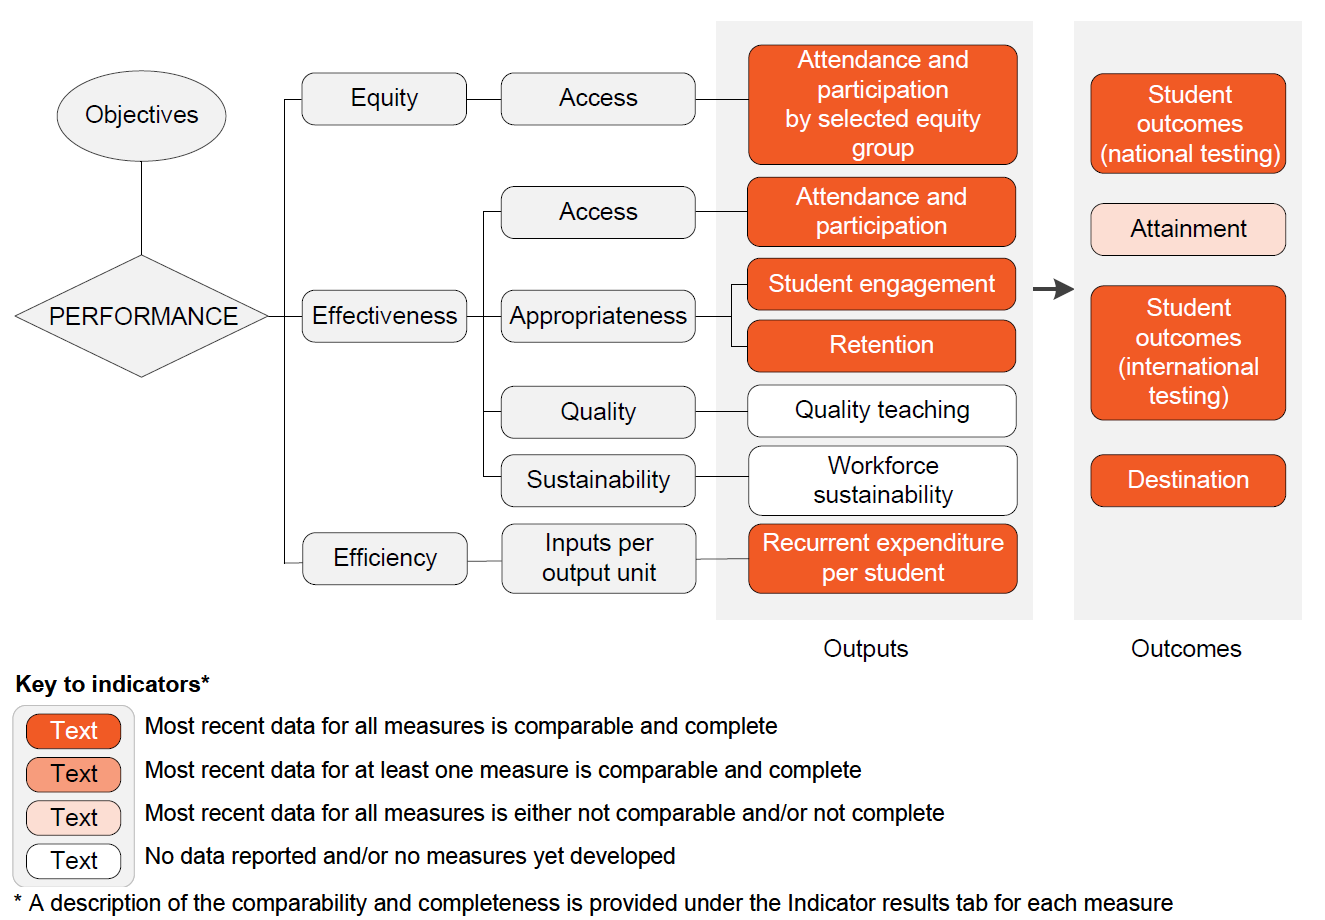
Performance – linked to Objectives
Outputs
Equity – Access
- Attendance and participation by selected equity group – most recent data for all measures is comparable and complete
Effectiveness – Access
- Attendance and participation – most recent data for all measures is comparable and complete
Effectiveness – Appropriateness
- Student engagement – most recent data for all measures is comparable and complete
- Retention – most recent data for all measures is comparable and complete
Effectiveness – Quality
- Quality teaching – no data reported and/or no measures yet developed
Effectiveness – Sustainability
- Workforce sustainability – no data reported and/or no measures yet developed
Efficiency – Inputs per output unit
- Recurrent expenditure per student – most recent data for all measures is comparable and complete
Outcomes
- Student outcomes (national testing) – most recent data for all measures is comparable and complete
- Attainment – most recent data for all measures is either not comparable and/or not complete
- Student outcomes (international testing) – most recent data for all measures is comparable and complete
- Destination – most recent data for all measures is comparable and complete
A description of the comparability and completeness is provided under the Indicator results tab for each measure.
An overview of the School education services performance indicator results are presented. Different delivery contexts, locations and types of clients can affect the equity, effectiveness and efficiency of school education services.
Information to assist the interpretation of this data can be found with the indicators below and all data (footnotes and data sources) is available for download above as an excel spreadsheet and as a CSV dataset. Data tables are identified by a '4A' prefix (for example, table 4A.1).
Specific data used in figures can be downloaded by clicking in the figure area, navigating to the bottom of the visualisation to the grey toolbar, clicking on the 'Download' icon and selecting 'Data' from the menu. Selecting 'PDF' or 'Powerpoint' from the 'Download' menu will download a static view of the performance indicator results.
‘Attendance by selected equity group’ is an indicator of governments’ objective for school education services to be provided in an equitable manner.
‘Attendance by selected equity group’ compares the attendance rate of those in the selected equity group (Aboriginal and Torres Strait Islander students, students in remote or very remote areas) with the attendance rate of those outside the selected equity group (non‑Indigenous students, students in major cities, and inner and outer regional areas).
Similar rates of attendance for those within and outside the selected equity groups indicates equity of access.
The student attendance rate is the number of actual full-time equivalent student-days attended by full-time students in Semester 1 as a percentage of the total number of possible student-days attended in Semester 1.
Nationally in 2024, attendance rates for students in Years 1–10 was 89.2% in major cities, decreasing to 81.0% in remote areas and 65.8% in very remote areas (figure 4.2a). The decrease was greater for Aboriginal and Torres Strait Islander students than for non-Indigenous students. This pattern was similar for government and non‑government schools, where the average attendance rates in major cities were higher than remote locations (table 4A.16).
Nationally in 2024, in all school sectors, the average attendance rate for non‑Indigenous students was higher than for Aboriginal and Torres Strait Islander students across all year levels in all jurisdictions (figure 4.2b and tables 4A.16–19). The attendance gap was larger at the higher Year levels.

The student attendance level is the proportion of full-time students whose attendance rate is greater than or equal to 90% over the period. Analysis of the attendance level can highlight ‘at risk’ populations (where a large proportion of individuals have had low attendance over the school year). Data on the student attendance level by Indigenous status and remoteness are in tables 4A.20–22.
‘Attendance’ is an indicator of governments’ objective that school education services promote student participation.
‘Attendance’ is defined by the student attendance rate – the number of actual full-time equivalent student-days attended by full-time students in Semester 1 as a percentage of the total number of possible student‑days attended in Semester 1.
Higher or increasing rates of attendance are desirable. Poor attendance has been related to poor student outcomes, particularly once patterns of non‑attendance are established (Hancock et al. 2013).
Nationally in 2024 across all schools, attendance rates decreased from 88.8% in Year 7 to 84.0% in Year 10 (figure 4.3). For Years 7–10, attendance rates are higher at non‑government schools (89.5%) than government schools (83.4%) (tables 4A.17–18).
Nationally in 2024, the attendance rate for all school students for Years 1–6 was 90.0%, a decrease of 3.0 percentage points since 2018 (figure 4.3).
‘Student engagement’ is an indicator of governments’ objective that school education services engage all students.
‘Student engagement’ is defined as encompassing the following three dimensions:
- behavioural engagement – which may be measured by identifiable behaviours of engagement, such as school attendance, attainment and retention
- emotional engagement – which may be measured by students’ attitudes to learning and school
- cognitive engagement – which may be measured by students’ perception of intellectual challenge, effort or interest and motivation (Fredricks, Blumenfeld, and Paris 2004).
It is measured using data from the Programme for International Student Assessment (PISA) – a triennial assessment of 15-year‑old students conducted by the Organisation for Economic Cooperation and Development (OECD) that also collects student and school background contextual data. PISA collects information on one aspect of emotional engagement – students’ sense of belonging at school. Students’ level of agreement to six statements are combined to construct a Sense of Belonging at School Index (table 4A.23).
Higher or increasing scores on the index of sense of belonging at school (index) illustrate a greater sense of belonging at school, which is desirable. The index is standardised to have a mean of zero across OECD countries. Higher values of the index indicate a greater sense of belonging at school than the OECD average and lower values indicate a lesser sense of belonging at school than the OECD average.
This data should be interpreted with caution, as it is limited to one aspect of emotional engagement and captured for 15-year-old students.
National data is not currently agreed to report against behavioural or cognitive engagement. However contextual information is provided on state and territory government student engagement surveys, where they have been conducted (table 4.1). These surveys collect information from students across the behavioural, emotional, and cognitive domains of engagement. In addition, some aspects of behavioural engagement are captured via the attendance, retention and attainment indicators.
Nationally in 2022, the proportion of 15-year-old students that agreed or disagreed with the following statements was:
- I make friends easily at school (agree) – 77.6% (± 0.9)
- I feel like I belong at school (agree) – 70.2% (± 1.0)
- Other students seem to like me (agree) – 86.2% (± 0.8)
- I feel like an outsider (or left out of things) at school (disagree) – 78.9% (± 0.9)
- I feel awkward and out of place at my school (disagree) – 75.0% (± 0.9)
- I feel lonely at school (disagree) – 81.9% (± 0.8) (figure 4.4).
From these responses, the sense of belonging at school index for Australian students aged 15 years was ‑0.23 (± 0.02) in 2022, down from -0.19 (± 0.02) in 2018 (figure 4.4). In 2022, the mean score varied between states and territories, and most results were not significantly different from 2018, except for the decrease in Victoria.
National data on the index, by selected equity group (sex, Indigenous status, geolocation, and socio-economic background) are included in table 4A.24.
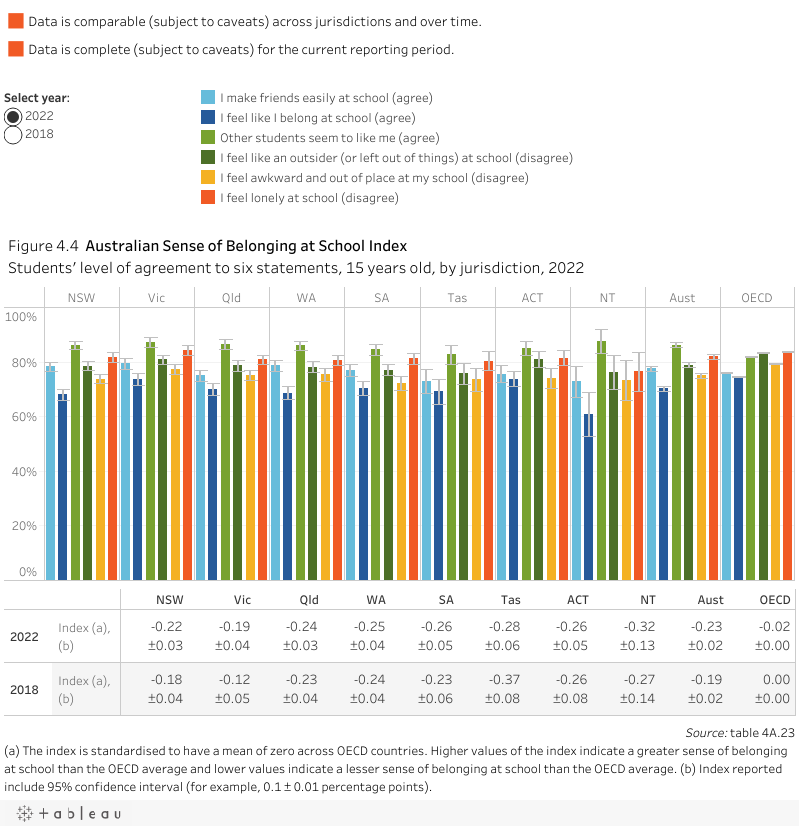
Table 4.1 School student engagement survey results
| Key features | Student engagement data is collected from New South Wales government schools twice a year, in Term 2 and Term 3 through the Tell Them From Me survey (except in 2024, where data was collected once in Term 2). The survey is for students in Years 4 to 6 (primary schools) and Years 7 to 12 (high schools) and is available to all departmental schools. |
|---|---|
| Domain | The survey collects data on the key domains of student engagement: behavioural, emotional and cognitive, using questions related to the following topics: Behavioural engagement related:
Emotional engagement related:
Cognitive engagement related:
|
| Statistics | Student engagement is multi-dimensional and differs across school years. As such, there is no single indicator of engagement. Longitudinal modelling conducted by the New South Wales Department of Education shows that various drivers of student engagement can impact student outcomes. Students who demonstrate positive attitudes towards attendance and behaviour, and are academically motivated can be several months ahead in their learning compared with students who do not demonstrate these traits. Similarly, students who have a positive sense of belonging, who experience high academic expectations and high levels of advocacy at school experience a range of positive schooling outcomes. |
| Link | More information, including results from longitudinal modelling, is available from the New South Wales Department of Education website: |
| Key features | The annual Attitudes to School Survey gathers data to support: (1) student health and wellbeing; (2) engagement; (3) school improvement; and (4) planning in Victorian government schools. The online survey captures the attitudes and experiences of students in Years 4 to 12 and is designed principally to inform improvement opportunities within government schools. In 2023, over 359,000 students in more than 1,500 schools completed the survey. |
|---|---|
| Domain | The Attitudes to School Survey measures aspects of student’s emotional and cognitive engagement, using questions related to the following topics: Behavioural engagement related:
Emotional engagement related:
Cognitive engagement related:
|
| Statistics | Results for 2023 indicate that the majority of Victorian government school students feel connected to their schooling. On a five-point Likert scale, students in Years 5 to 6 recorded a mean score of 4.0 and students in Years 7 to 9 recorded a mean score of 3.2. |
| Link | More information is available from the Victorian Department of Education website: https://www2.education.vic.gov.au/pal/data-collection-surveys/policy |
| Key features | The Queensland Engagement and Wellbeing (QEW) Survey collects data from Queensland state schools in a consistent and systematic way to gain a better understanding of the wellbeing and engagement of students. The survey is offered to schools annually in Term 2 on a voluntary basis for students in Years 4 to 12. There are ongoing projects to make the survey more accessible and inclusive for all students, including students with disability, those learning English as an Additional Language or Dialect, and Aboriginal and Torres Strait Islander students. In 2024, 122,240 students from 518 government schools participated. |
|---|---|
| Domain | The QEW Survey measures 22 constructs across 12 domains that span both student wellbeing and engagement. It includes questions about the following topics: Behavioural engagement related:
Emotional engagement related:
Cognitive engagement related:
|
| Statistics | No summary statistics have been publicly released. |
| Link | More information is available from the Queensland Department of Education website: https://qed.qld.gov.au/our-publications/reports/statistics/schooling/students/Pages/engagement-wellbeing-survey.aspx |
| Key features | The Speaking Out Survey (SOS) is a representative survey of Western Australian children and young people’s wellbeing across several domains: life satisfaction, safety, health, sense of belonging, material basics and access to support. Over 16,500 students in Years 4 to 12 from 114 government and non-government schools participated in the latest 2021 survey. The 2025 SOS aims to survey up to 20,000 students in Years 4 to 12 from government, independent, and catholic schools. This survey will be conducted in Term 2 of 2025. | ||||||||||||||||||||||||||||||||||||||||||||||||||||||||||||||||||||||||||||||||||||||||||||||||||||||||||
|---|---|---|---|---|---|---|---|---|---|---|---|---|---|---|---|---|---|---|---|---|---|---|---|---|---|---|---|---|---|---|---|---|---|---|---|---|---|---|---|---|---|---|---|---|---|---|---|---|---|---|---|---|---|---|---|---|---|---|---|---|---|---|---|---|---|---|---|---|---|---|---|---|---|---|---|---|---|---|---|---|---|---|---|---|---|---|---|---|---|---|---|---|---|---|---|---|---|---|---|---|---|---|---|---|---|---|---|
| Domain | The SOS collects data on the key domains of student engagement: behavioural, emotional and cognitive, using questions related to the following topics: Behavioural engagement related:
Emotional engagement related:
Cognitive engagement related:
| ||||||||||||||||||||||||||||||||||||||||||||||||||||||||||||||||||||||||||||||||||||||||||||||||||||||||||
| Statistics |
| ||||||||||||||||||||||||||||||||||||||||||||||||||||||||||||||||||||||||||||||||||||||||||||||||||||||||||
| Link | SOS results are available from: https://ccyp.wa.gov.au/our-work/speaking-out-survey-report The next survey is scheduled for 2025. |
| Key features | Data is sourced from the Wellbeing and Engagement Collection (WEC). The purpose of the survey is to seek students’ views about their wellbeing and engagement with school. The survey asks students about their social and emotional wellbeing; school relationships and engagement and learning in school; and physical health and wellbeing and after school activities. Students’ answers are kept confidential. The WEC is collected annually in Term 2 in 2024 (6 May to 31 May 2024) from students in Year levels 4 to 12. All schools, government and non-government, are invited to participate. The survey is voluntary at a school, student and question level. In 2024, 526 schools and 103,978 students in government and non-government schools participated; 93% (477 out of 508) of all government schools participated in the WEC. | ||||||||||||||||||||||||||||||||||||||||
|---|---|---|---|---|---|---|---|---|---|---|---|---|---|---|---|---|---|---|---|---|---|---|---|---|---|---|---|---|---|---|---|---|---|---|---|---|---|---|---|---|---|
| Domain | The WEC includes questions related to the following sub-domains of engagement: Behavioural engagement related:
Emotional engagement related:
Cognitive engagement related:
| ||||||||||||||||||||||||||||||||||||||||
| Statistics |
| ||||||||||||||||||||||||||||||||||||||||
| Link | More information is available from the South Australian Department of Education website: https://www.education.sa.gov.au/department/research-and-data/wellbeing-and-engagement-collection/about-wellbeing-and-engagement-collection |
| Key features | The Tasmanian Department for Education, Children and Young People conducts an annual Student Wellbeing and Engagement Survey (SWES) for students in Years 4 to 12 in Tasmanian government schools. This survey was first run in 2019, with the most recent results from 2023. The Student Wellbeing and Engagement Survey supports the Tasmanian Department for Education, Children and Young People’s Child and Student Wellbeing Strategy: Wellbeing for Learning. The Wellbeing Strategy supports the Tasmanian Child and Youth Wellbeing Framework and adopts the six Australian Research Alliance for Children and Youth wellbeing domains: Loved and Safe, Material Basics, Healthy, Learning, Participating and Positive sense of culture and identity. In 2023, 28,750 students in government schools participated in the SWES. |
|---|---|
| Domain | The domain of Learning within the Student Wellbeing and Engagement Survey measures the following subdomains of engagement:
|
| Statistics | The levels of engagement are determined based on respondents who indicated medium or high wellbeing, as a proportion of all responses across the questions associated with the three Learning sub-domains associated with engagement in the Student Wellbeing and Engagement Survey. In 2023 these are:
|
| Link | Information on the Student Wellbeing and Engagement Survey may be found at: https://www.decyp.tas.gov.au/wellbeing/student-wellbeing-and-engagement-survey Additional information on the department’s Child and Student Wellbeing Strategy may be found at: https://www.decyp.tas.gov.au/about-us/strategies-and-frameworks/our-approach-to-wellbeing |
| Key features | The Australian Capital Territory conducts the Australian School Climate and School Identification Measurement Tool (ASCSIMT) survey in all public schools. All students in Years 4 to 12, school staff and parents of all students from preschool to Year 12 are invited to complete the survey. The ASCSIMT was developed in partnership with the Australian National University. The survey explores the relationships between school climate and the sense of belonging of students and how these relate to student behavioural and emotional engagement and to a number of domains of student wellbeing and behaviour. The survey is conducted every August in conjunction with the School Satisfaction Survey |
|---|---|
| Domain | The domains addressed by the ASCSIMT include: Behavioural engagement related:
Emotional engagement related:
Cognitive engagement related:
|
| Statistics | Not published |
| Link | The survey allows for longitudinal research into student engagement. Results of the survey are not published. |
| Key features | The Northern Territory Department of Education annual School Survey collects the opinions of staff, students and their families about school performance, culture and services. The Northern Territory School Survey is conducted in all Northern Territory government schools across weeks 4 to 8 of Term 3 (5 August 2024 to 6 September 2024). There are three different versions of the survey designed to specifically target: students in Years 5 to 12, parents and carers of students at all year levels and school-based staff including teaching and administration staff. Over 15,000 students, parents and staff took part in the 2023 Northern Territory School Survey. |
|---|---|
| Domain | The Northern Territory School Survey contains questions that aim to provide schools with key insights into student wellbeing, engagement, and learning experiences from the perspective of students, parents and school staff. The Survey includes triangulated questions related to the following domains: Behavioural engagement related:
Emotional engagement related:
Cognitive engagement related:
|
| Link | More information is available from the Northern Territory Department of Education website: https://education.nt.gov.au/statistics-research-and-strategies/school-survey |
Source: State and territory governments (unpublished).
‘Retention’ to the final years of schooling is an indicator of governments’ objective that the school education system aims to engage all students and promote student participation.
‘Retention’ (apparent retention rate) is defined as the number of full-time school students in Year 10 that continue to Year 12.
The term ‘apparent’ is used because the measures are derived from total numbers of students in each of Year 10 and Year 12, not by tracking the retention of individual students. Uncapped rates (rates that can be greater than 100%) are reported for the time series analysis. Care needs to be taken in interpreting the measures as they do not take account of factors such as:
- students repeating a year of education or returning to education after a period of absence
- movement or migration of students between school sectors, between states and territories and between countries
- the impact of full fee-paying overseas students.
These factors may lead to uncapped apparent retention rates that exceed 100%.
This indicator does not include part-time or ungraded students, except for ungraded students in New South Wales Government mainstream schools. This has implications for the interpretation of results for all jurisdictions. Also excluded is information on students who pursue Year 12 (or equivalent qualifications) through non‑school pathways.
Apparent retention rates are affected by factors that vary across jurisdictions. For this reason, variations in apparent retention rates over time within jurisdictions may be more useful than comparisons across jurisdictions.
A higher or increasing rate is desirable as it suggests that a larger proportion of students are continuing in school, which may result in improved educational outcomes.
Nationally in 2024, the apparent retention rate from Year 10 to Year 12 for full-time students was 79.9%, an increase on 2023 (78.7%), but below the 10 year time series high of 83.3% in 2017 (figure 4.5). The rate was higher for non-government schools (88.1%) (Table 4A.26) than for government schools (74.3%) (Table 4A.27). Both Aboriginal and Torres Strait Islander students and non‑Indigenous students had similar trends.
Consistent with the NYPR mandatory requirement, all young people must participate in schooling until they complete Year 10. The apparent retention rate for all schools from the commencement of secondary school (at Year 7 or 8) to Year 10 has remained above 97% in all jurisdictions (except the Northern Territory) since 2015. Nationally, the retention rate for Aboriginal and Torres Strait Islander students was 98.7% in 2024, but below that of non‑Indigenous students (table 4A.25).

‘Quality teaching’ is an indicator of governments’ objective that school education delivers high quality teaching of a world‑class curriculum. A good quality curriculum provides the structure for the provision of quality learning (UNESCO‑IBE 2016), while teachers are the single most important ‘in‑school’ influence on student achievement (Hattie 2009). Teacher quality can influence student educational outcomes both directly and indirectly, by fostering a positive, inclusive and safe learning environment (Boon 2011).
‘Quality teaching’ is defined in relation to the teaching environment, including the quality of the curriculum and the effectiveness of the teachers. Teachers are considered effective where they:
- create an environment where all students are expected to learn successfully
- have a deep understanding of the curriculum and subjects they teach
- have a repertoire of effective teaching strategies to meet student needs
- direct their teaching to student needs and readiness
- provide continuous feedback to students about their learning
- reflect on their own practice and strive for continuous improvement (PC 2012).
This indicator may be measured in future by student responses to survey questions on their perceptions of the teaching environment including the curriculum. High or increasing proportions of students indicating positive responses to the teaching environment are desirable.
Data is not yet available for reporting against this indicator.
‘Workforce sustainability’ is an indicator of governments’ objective to provide sustainable school education services.
School teacher workforce sustainability relates to the capacity of the school teacher workforce to meet current and projected future service demand. These measures are not a substitute for a full workforce analysis that allows for training, migration, changing patterns of work and expected future demand. They can, however, indicate that further attention should be given to workforce planning for school education services.
This indicator is currently under development for reporting in the future.
‘Recurrent expenditure per student’ is an indicator of governments’ objective to provide school education services in an efficient manner.
‘Recurrent expenditure per student’ is defined as total government recurrent expenditure per FTE student, reported for government schools and for non‑government schools. Government recurrent expenditure per FTE student includes estimates for the User Cost of Capital (UCC) for government schools (more details are under ‘Interpreting efficiency data’ in the ‘Explanatory material’ tab). UCC is not included for non‑government schools.
FTE student numbers (table 4A.7) are drawn from the ABS publication Schools Australia 2023 (ABS 2024) and averaged over two calendar years to match the financial year expenditure data.
Holding other factors constant, a low or decreasing government recurrent expenditure or staff expenditure per FTE student may represent better or improved efficiency.
Care should be taken with interpreting efficiency data as:
- a number of factors beyond the control of governments, such as economies of scale, a high proportion of geographically remote students or a dispersed population, and migration across states and territories, may influence expenditure.
- while high or increasing expenditure per student may reflect deteriorating efficiency, it may also reflect changes in aspects of schooling (increasing school leaving age, improving outcomes for students with special needs, broader curricula or enhancing teacher quality), or the characteristics of the education environment (such as population dispersion).
- reporting requirements and methodologies may vary between years. Refer to footnotes in the data tables.
Nationally in 2022-23, government recurrent expenditure per FTE student in all schools was $21,169 (figure 4.6). Between 2013‑14 and 2022‑23, real government expenditure per FTE student increased at an average rate of 2.8% per year (table 4A.28).
Nationally in 2022‑23, government recurrent expenditure per FTE student in non‑government schools was $14,561 (excluding UCC). Between 2013‑14 and 2022‑23, real government expenditure per FTE student increased at an average rate of 3.1% per year (figure 4.6).
Nationally in 2022‑23, government recurrent expenditure (including UCC) was $24,857 per FTE student in government schools (excluding UCC this was $20,581; refer to table 4A.29). Between 2013‑14 and 2022‑23, real government expenditure (including UCC) per FTE student increased at an average rate of 2.8% per year (figure 4.6).
In-school expenditure per FTE student was higher for government secondary schools ($25,861 per FTE student) compared to government primary schools ($22,149 per FTE student). Out-of-school government expenditure per FTE student was substantially lower ($1,210 per FTE student) (table 4A.29).
Differences in the ‘student-to-staff ratio’ can provide some context to differences in the government recurrent expenditure per FTE student (tables 4A.13–14). Further information is available under ‘Size and scope’ in the ‘Context’ tab.
‘Student outcomes (national testing)’ is an indicator of governments’ objective that Australian schooling aims for all young Australians to become successful lifelong learners, confident and creative individuals, and active and informed members of the community.
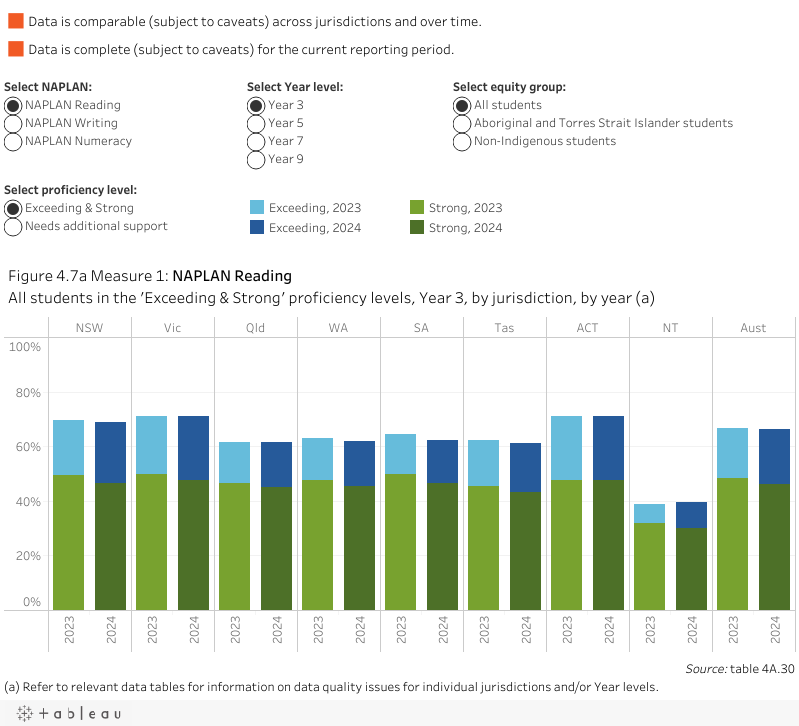
‘Student outcomes (national testing)’ is defined by two measures drawn from the National Assessment Program – Literacy and Numeracy (NAPLAN) and National Assessment Program (NAP) sample assessments:
- NAPLAN testing is undertaken by students in Years 3, 5, 7 and 9. Results are reported in the NAPLAN national report for four levels of proficiency: Exceeding, Strong, Developing and Needs additional support, and mean scale score, for reading, writing and numeracy (ACARA 2023).
- As the key performance measure for NAPLAN results is under development, NAPLAN results will be reported in RoGS as the proportion of students achieving the ‘Exceeding’ or ‘Strong’ levels for reading, writing and numeracy. The mean scale score refers to a mean (average) score on a common national scale.
- States and territories have different school starting ages resulting in differing average ages of students and time spent in schooling at the time of testing. Refer to table 4.2 for more information on the average ages of students across jurisdictions at the time of testing in 2024.
- Results from 2023 mark the start of a new time series due to NAPLAN changes including: resetting the NAPLAN measurement scales; all tests being held online, except Year 3 writing test; and test dates being moved from May to March. With all schools nationally participating in the online adaptive NAPLAN testing, restarting the time series sets a new baseline for future comparisons of more precise data. Results from 2023 are not directly comparable with the paper test results of previous years.
- NAP Sample assessments: NAP sample assessments are undertaken by a representative sample of students in Years 6 and 10, on a triennial, rotating basis. Measures are reported for the proportion of students at or above the proficient standard in NAP assessments as well as mean scale scores for Civics and citizenship literacy, Science literacy and Information and communication technologies (ICT) literacy.
- The proficient standards, which vary across the tests, represent a challenging but reasonable level of expectation of student achievement, with students needing to demonstrate more than minimal or elementary skills expected at their year level to be regarded as achieving the standard.
Most data is accompanied by confidence intervals. The ‘Explanatory material’ tab includes details on NAPLAN and NAP confidence intervals.
A high or increasing mean scale score or proportion of students achieving ‘Exceeding’ or ‘Strong’ proficiency levels (NAPLAN) or at or above the proficiency standard (NAP) is desirable.
Nationally for NAPLAN, the proportion of students achieving ‘Exceeding’ or ‘Strong’ proficiency levels in 2024 ranged from:
- for reading – 63.0% for Year 9 students to 71.3% for Year 5 students (figure 4.7a)
- for writing – 61.0% for Year 9 students to 76.8% for Year 3 students (table 4A.34)
- for numeracy – 63.4% and 63.5% for Year 9 and Year 3 students, respectively, to 67.8% for Year 5 students (table 4A.38).
The proportion of students achieving the four proficiency levels for reading, writing and numeracy by selected equity group (Indigenous status, geolocation, parental education and parental occupation) are in tables 4A.30, 4A.32, 4A.34, 4A.36, 4A.38 and 4A.40.
Mean scale scores reported for reading, writing and numeracy by selected equity group (Indigenous status, geolocation, parental education and parental occupation) are in tables 4A.31, 4A.33, 4A.35, 4A.37, 4A.39 and 4A.41 respectively.
Students are counted as participating if they were assessed or deemed exempt (other students identified as absent or withdrawn are counted as not participating). In 2024, the overall NAPLAN participation rate for Australia was 93.6% across all year levels for the reading, writing and numeracy domains, similar to 2023 (93.5%). Participation rates ranged from 88.6% to 95.9% across all year levels for these domains (ACARA 2024).
| State/territory | Year 3 | Year 5 | Year 7 | Year 9 |
|---|---|---|---|---|
| NSW | 8 y 6 m | 10 y 6 m | 12 y 6 m | 14 y 5 m |
| Vic | 8 y 7 m | 10 y 7 m | 12 y 7 m | 14 y 7 m |
| Qld | 8 y 4 m | 10 y 4 m | 12 y 4 m | 14 y 4 m |
| WA | 8 y 3 m | 10 y 3 m | 12 y 3 m | 14 y 3 m |
| SA | 8 y 5 m | 10 y 5 m | 12 y 5 m | 14 y 5 m |
| Tas | 8 y 9 m | 10 y 9 m | 12 y 9 m | 14 y 9 m |
| ACT | 8 y 6 m | 10 y 6 m | 12 y 6 m | 14 y 6 m |
| NT | 8 y 4 m | 10 y 4 m | 12 y 4 m | 14 y 4 m |
| Aust | 8 y 5 m | 10 y 6 m | 12 y 5 m | 14 y 5 m |
Nationally in 2024, 43.0% (± 2.5) of Year 6 students and 28.0% (± 2.2) of Year 10 students achieved at or above the proficient standard in NAP civics and citizenship literacy performance (figure 4.7b). Both proportions decreased by around 10 percentage points between 2019 and 2024. Mean scale scores for civics and citizenship literacy performance are in table 4A.43. National data on the proportion of students achieving at or above the proficient standard by selected equity group (sex, Indigenous status, remoteness area, parental occupation and parental education) are in table 4A.44.
Nationally in 2023, 57.0% (± 2.5) of Year 6 students and 54.0% (± 2.9) of Year 10 students achieved at or above the proficient standard in NAP science literacy (table 4A.45). These results are statistically similar to 2018. Mean scale scores for science literacy performance are in table 4A.46. National data on the proportion of students achieving at or above the proficient standard by selected equity group (sex, Indigenous status, remoteness area, parental occupation and parental education) are in table 4A.47.
Nationally in 2022, 55.0% (± 2.4) of Year 6 students achieved at or above the proficiency standard in NAP ICT literacy performance, similar to the previous cycle in 2017 (table 4A.48). A significantly lower proportion of Year 10 students achieved at or above the proficiency standard in ICT literacy performance in 2022 (46.0% (± 3.2)) compared to 2017 (54.0% (± 3.0)). Mean scale scores for ICT literacy are in table 4A.49. National data on the proportion of students achieving at or above the proficient standard by selected equity group (sex, Indigenous status, remoteness area, parental occupation and parental education) are in table 4A.50.

‘Attainment’ is an indicator of governments’ objective that Australian schooling aims for all young Australians to become successful lifelong learners, confident and creative individuals, and active and informed members of the community.
‘Attainment’ (or Year 12 Certification rate) is defined as the number of students who meet the requirements of a Senior Secondary Certificate or equivalent expressed as a percentage of the potential Year 12 population. The potential Year 12 population is an estimate of a single year age group that could have attended Year 12 that year, calculated as the estimated resident population aged 15–19 years divided by five.
This indicator should be interpreted with caution as:
- assessment, reporting and criteria for obtaining a Year 12 or equivalent certificate varies across jurisdictions
- students completing their secondary education in Technical and Further Education (TAFE) institutes are included in reporting for some jurisdictions and not in others
- the aggregation of all postcode locations into three socio-economic status categories – high, medium and low – means there may be significant variation within the categories. The low category, for example, will include locations ranging from those of extreme disadvantage to those of moderate disadvantage.
A high or increasing Year 12 Certification rate is desirable.
The Australian Government Department of Education is currently reviewing the methodology for reporting Year 12 certification data.
Nationally in 2022, the Year 12 Certification rate for all students was 76.3%. The rates increased as socio‑economic status increased. Across remoteness areas, the rates were substantially lower in very remote areas compared to other areas (figure 4.8).

The proportion of the population aged 20–24 years who had attained at least Year 12 or AQF Certificate III or above was 90.0% in 2024, up from 88.2% in 2019 (table 4A.53). Data by remoteness is also included in table 4A.53.
‘Student outcomes (international testing)’ is an indicator of governments’ objective that Australian schooling aims for students to excel by international standards.
‘Student outcomes (international testing)’ is defined by Australia’s participation in three international tests:
- Trends in International Mathematics and Science Study (TIMSS) – conducted by the International Association for the Evaluation of Educational Achievement (IEA) as a quadrennial international assessment – measures the proportion of sampled Year 4 and Year 8 students achieving at or above the IEA intermediate international benchmark, the national proficient standard in Australia for mathematics and science in the TIMSS assessment.
- Programme for International Student Assessment (PISA) – conducted by the OECD as a triennial international assessment – measures the proportion of sampled 15-year-old students achieving at or above the national proficient standard (set to level 3) on the OECD PISA combined scales for reading, mathematical and scientific literacy.
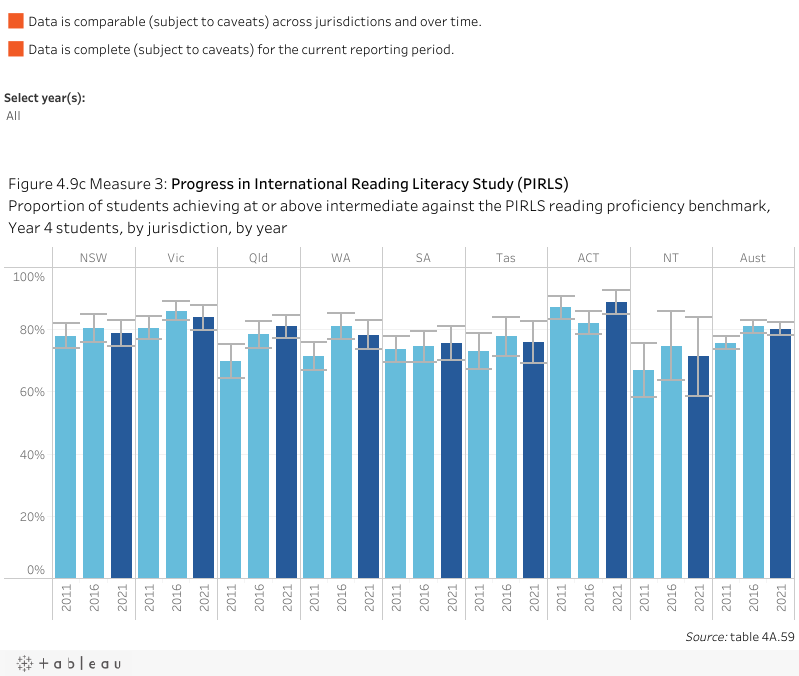
- Progress in International Reading Literacy Study (PIRLS) – conducted by the IEA as a quinquennial international assessment – measures the proportion of sampled Year 4 students achieving at or above the IEA intermediate international benchmark, the national proficient standard in Australia for reading literacy in the PIRLS assessment.
A high or increasing proportion of students achieving at or above the national proficient standard, or a high or increasing mean scale score is desirable.

PISA
Nationally in 2022, the proportion of Australian 15-year-old students who achieved the national proficient standard (level 3 or above) in:
- reading literacy was 57.4% (± 0.7) (figure 4.9b)
- mathematical literacy was 50.8% (± 1.5) (table 4A.57)
- scientific literacy was 58.2% (± 1.5) (table 4A.58).
Across the three literacy domains, the proportions of Australian 15-year-old students who achieved at or above the national proficient standard in 2022 were significantly lower than the proportions in 2018 for mathematics literacy, but similar to the proportions in 2018 for reading literacy and scientific literacy (tables 4A.56–58).
In 2022, Australian 15-year-old students performed higher than the OECD average for all three assessment domains (De Bortoli, Underwood and Thomson 2023).

PIRLS
Nationally in 2021, the proportion of Year 4 students that achieved at or above the national proficient standard for reading literacy was 80.2% (± 2.0), similar to 2016 (figure 4.9c). Across jurisdictions, the Australian Capital Territory was the only jurisdiction to show a significant improvement (table 4A.59).
Of the countries that participated in the PIRLS assessment in 2021, Australian Year 4 students:
- significantly outperformed students from 28 other countries.
- were significantly outperformed by students from six other countries (ACER 2023).
‘Destination’ is an indicator of governments’ objective that Australian schooling aims for all young Australians to become active and informed members of the community positioning them to transition to further study or work and successful lives.
‘Destination’ is defined as the proportion of school leavers aged 15–24 years who left school in the previous year, who are participating in further education, training or employment. Data is reported for school leavers whose highest level of school completed was Year 12, or Year 11 and below.
A higher or increasing proportion of school leavers participating in further education, training or employment is desirable.
Data is sourced from the Survey of Education and Work and for this indicator relate to the jurisdiction in which the young person was a resident the year of the survey and not necessarily the jurisdiction in which they attended school.
This report includes information on the student destination surveys conducted by each state and territory government, as context to this indicator (table 4.3). These surveys collect information from a larger number of students within relevant jurisdictions, but the research methods and data collection instruments differ which do not enable comparative reporting.
The proportion of all school leavers aged 15–24 years who left school in 2023 and who in 2024 were fully engaged in work or study was 63.9% (figure 4.10). Proportions were higher for Year 12 completers (68.7%), compared to those who completed Year 11 and below (52.6%) (table 4A.60).

Table 4.3 School leaver destination survey results
| Key features | The New South Wales Post-School Destinations and Experiences Survey commenced in 2010 and has been conducted annually since 2013, collecting information about students’ main destinations in the year after leaving school, either having completed Year 12 or left early. The survey includes students from government, Catholic and independent schools and can be completed online or via the telephone. The last survey was conducted in 2023 and results will be published in December 2024. In 2022, the sample comprised 29,457 Year 12 completers and 5,923 early school leavers. The population counts are 63,685 for Year 12 completers and 25,398 for early school leavers. |
|---|---|
| Statistics | Of the Year 12 completers, 70.4% were undertaking some form of education and training (53.6% a bachelor degree, 6.5% a vocational education and training (VET) course [including advanced diplomas, diplomas and certificates I to IV], 5.7% an apprenticeship and 4.6% a traineeship), 23.8% were employed, 3.8% looking for work and 2.1% were not in the labour force, education or training. Of the early school leavers 58.1% were undertaking some form of education or training (34.3% an apprenticeship, 13% a VET course, 9.4% a traineeship and 1.5% a bachelor degree), 27.4% were employed, 10.9% looking for work and 3.6% were not in the labour force, education or training. |
| Link | Analytical reports and fact sheets providing detailed information on participant subgroups can be accessed from the New South Wales Department of Education website when the Minister has approved publication. Past reports can be found at https://education.nsw.gov.au/about-us/education-data-and-research/cese/publications/research-reports. |
| Key features | Since 2003, the Department of Education’s annual On Track survey has recorded the post-school destinations of Victorian students who complete Year 12, or who leave school in Years 10, 11 and 12 without completing. Consenting students from all school sectors are invited to complete the On Track survey online with follow-ups conducted via a Computer Assisted Telephone Interview. The 2023 On Track survey was conducted from July to September 2023, including 16,158 students who completed Year 12 (completers) and 1,317 who left school (non-completers) in 2022. |
|---|---|
| Statistics | The majority of Year 12 completers were engaged in further education or training (74.0%), with most enrolled in a bachelor degree (54.9%), and smaller proportions in certificates or diplomas (9.9%) and apprenticeships or traineeships (9.1%). Year 12 completers not in education and training (26.0%) were either employed part-time (13.5%) or full-time (9.1%), looking for work (2.5%), or not in the labour force, education, or training (0.9%). Around half of non-completers were engaged in further education or training (52.7%), with apprenticeships or traineeships being the most popular pathway (35.9%), followed by certificates or diplomas (14.6%), and bachelor degrees (2.2%). Non-completers not in education or training (47.3%) were mostly employed part-time (18.8%) or full-time (14.3%), with smaller proportions looking for work (9.5%), or not in the labour force, education or training (3.2%). |
| Link | Information about the On Track survey, including the 2023 summary report, can be found on the Victorian Government website: https://www.vic.gov.au/on-track-survey. |
| Key features | Since 2005, Queensland’s annual Next Step survey has captured information about the journey from school to further study and employment. The survey takes place approximately six months after the end of the school year and asks a range of questions regarding graduates’ study and work choices. All students who completed Year 12 at government and non-government schools in Queensland are invited to participate and can complete the survey online or via the telephone. The 2024 survey ran from April to June and collected responses from 39,587 Year 12 completers, a 74.9% response rate. |
|---|---|
| Statistics | In 2024, 89.9% of respondents were engaged in education, training or employment six months after completing Year 12. A further 7.4% were seeking work, while 2.7% were not in the labour force, education or training. |
| Link | Survey outputs include individual school reports, sector and region reports, a state-wide infographic and a report builder tool that allows users to create a custom report for their region of interest. Reports are available from the Next Step website (http://www.qld.gov.au/nextstep) on September 30 each year. |
| Key features | Each year, a post-school destination survey of Western Australian government school Year 12 students from the previous year are combined with university and TAFE data to build a comprehensive understanding of Year 12 students’ destinations. Refinements to the 2024 collection processes have resulted in gaining destination data for substantially more students than in previous years. |
|---|---|
| Statistics | In 2024, post-school destination information was collected for 11,779 students (82.0% of the total Western Australian government school Year 12 student population in Semester 2, 2023). Of these students, 62.9% were in either education or training, with 38.2% at university, 4.4% studying an apprenticeship or a traineeship, 6.7% studying another type of nationally accredited training qualification, 2.6% repeating year 12 studies or engaged in non-accredited training and 11.0% who had deferred their education or training. In addition, 7.9% were engaged exclusively in full-time employment, 18.4% in part-time employment, and 10.9% were neither working nor studying. The figures may not sum to 100% due to rounding. |
| South Australia does not undertake a post-school destination survey. |
| Key features | Tasmania participated in GENERATION for the first time in 2022, a new national longitudinal survey of Year 10 students. GENERATION will provide insights into young people and their transitions from school into post-school education, training and the workforce. |
|---|---|
| Statistics | Summary statistics have been publicly released from this study at the link below. |
| Link | Refer to more information about this new collection at https://generationsurvey.org.au |
| Key features | Since 2007, the Australian Capital Territory has conducted a telephone-based survey of all government and non‑government students who successfully completed an Australian Capital Territory Senior Secondary Certificate in the preceding year, as well as students who left school before completing Year 12. The survey seeks information on the destinations of young people six months after completion of Year 12 and on satisfaction with their experience in Years 11 and 12. In 2018 this survey became multimodal with online self‑completion and telephone interviews being utilised. In 2024, responses were received from 51% of the 2023 Year 12 graduates who were sent a Primary Approach Letter. |
|---|---|
| Statistics | The 2024 survey (conducted between 21 May and 6 July) found that 93% of 2023 Year 12 graduates were employed and/or studying in 2024. Overall, 77% found Years 11 and 12 worthwhile. Of the 59% of 2023 graduates studying in 2024, 68% reported that they were studying at the higher education (advanced diploma or higher) level and 28% at the Vocational Education and Training (certificate I to IV and diploma) level. Of the 41% of graduates who were not studying in 2023, 64% intended to start some study in the next two years. Year 12 graduates who speak a language other than English at home were more likely to be studying (72%) than those who did not (55%). |
| Link | Data from this survey is published in the ‘ ACT Post School Destinations and Pathways ’ series at https://www.education.act.gov.au/about-us/policies-and-publications/publications_a-z/all-publications. |
| The Northern Territory does not currently conduct a post-school destination survey. |
Source: State and territory governments (unpublished).
Performance indicator data for Aboriginal and Torres Strait Islander people in this section are available in the data tables listed below. Further supporting information can be found in the ‘Indicator results’ tab and data tables.
| Table number | Table title |
|---|---|
| Table 4A.16 | Student attendance rates, by Indigenous status and remoteness |
| Table 4A.17 | Student attendance rates, government schools, by Indigenous status |
| Table 4A.18 | Student attendance rates, non-government schools, by Indigenous status |
| Table 4A.19 | Student attendance rates, all schools, by Indigenous status |
| Table 4A.20 | Student attendance level, government schools, by Indigenous status |
| Table 4A.21 | Student attendance level, non-government schools, by Indigenous status |
| Table 4A.22 | Student attendance level, by Indigenous status and remoteness |
| Table 4A.24 | PISA Sense of Belong at School Index, by equity group, Australia |
| Table 4A.25 | Apparent retention rates of secondary students, all schools |
| Table 4A.26 | Apparent retention rates of secondary students, government schools |
| Table 4A.27 | Apparent retention rates of secondary students, non-government schools |
| Table 4A.30 | NAPLAN Reading: Proportion of students by level of proficiency, by Indigenous status and geolocation |
| Table 4A.31 | NAPLAN Reading: Average NAPLAN score, by Indigenous status and geolocation |
| Table 4A.34 | NAPLAN Writing: Proportion of students by level of proficiency, by Indigenous status and geolocation |
| Table 4A.35 | NAPLAN Writing: Average NAPLAN score, by Indigenous status and geolocation |
| Table 4A.38 | NAPLAN Numeracy: Proportion of students by level of proficiency, by Indigenous status and geolocation |
| Table 4A.39 | NAPLAN Numeracy: Average NAPLAN score, by Indigenous status and geolocation |
| Table 4A.44 | National Assessment Program, civics and citizenship literacy performance: proportion of students at or above proficient standard, by selected equity group |
| Table 4A.47 | National Assessment Program, science literacy performance: proportion of students at or above proficient standard, by selected equity group |
| Table 4A.50 | National Assessment Program, information and communication technologies: proportion of students at or above proficient standard, by selected equity group |
An objective of the Steering Committee is to publish comparable estimates of costs. Ideally, such comparison should include the full range of costs to government. This section does not report on non‑government sources of funding, and so does not compare the efficiency of government and non‑government schools.
School expenditure data reported in this section
Efficiency indicators in this section are based on financial year recurrent expenditure on government and non‑government schools by the Australian Government and state and territory governments. Capital expenditure is generally excluded, but as Quality Schools funding and Students First funding cannot be separated into capital and recurrent expenditure, these payments are treated as recurrent expenditure in this section. Expenditure relating to
funding sources other than government (such as parent contributions and fees) are excluded.
Sources of data – government recurrent expenditure on government schools
Total recurrent expenditure on government schools is unpublished data sourced from the National Schools Statistics Collection (NSSC) finance.
- Each state and territory government reports its expenditure on government schools to the Government Schools Finance Statistics Group. Recurrent expenditure on government schools comprises: employee costs (including salaries, superannuation, workers compensation, payroll tax, termination and long service leave, sick leave, fringe benefits tax); capital related costs (depreciation and user cost of capital [UCC]); umbrella departmental costs; and other costs (including rent and utilities). The Government Schools Finance Statistics Group provides unpublished data on the UCC for government schools, imputed as 8% of the written down value of assets (table 4A.4).
- The Australian Government reports its allocation to each state and territory for government schools, consistent with Treasury Final Budget Outcomes – including the Quality Schools funding (from 1 January 2018), Students First funding (to 31 December 2017) and a range of National Partnership payments (table 4A.3).
- To avoid double counting, Australian Government allocations are subtracted from the Australian, state and territory expenditure to identify ‘net’ state and territory government expenditure (table 4A.1).
Sources of data – government recurrent expenditure on non‑government schools
Total recurrent expenditure on non‑government schools is sourced from unpublished data from state and territory governments, and published data from the Australian Government as follows:
- Each state and territory government provides unpublished data on its contributions to non‑government schools (table 4A.1).
- The Australian Government reports its allocation to each state and territory for non‑government schools, consistent with Treasury Final Budget Outcomes – including the Quality Schools funding (from 1 January 2018), Students First funding (to 31 December 2017) and National Partnership payments (refer to table 4A.3).
Allocation of funding
Quality Schools package – Australian Government
From 1 January 2018 the Australian Government introduced the Quality Schools package replacing the Students First funding model which had been in effect since 1 January 2014. The Quality Schools package is needs based. Commonwealth funding is based on the Schooling Resource Standard that provides a base amount per student and additional funding for disadvantage. Students with greater needs will attract higher levels of funding from the Commonwealth. Funding is provided for government and non-government schools.
State and territory governments
In general, state and territory government schools systems are funded based on a variety of formulas to determine a school’s recurrent or base allocation, with weightings and multipliers added for students facing disadvantage. For non‑government schools, state and territory governments also provide funding for recurrent and targeted purposes, usually through per capita allocations. Indexation of costs is normally applied to these funding arrangements for both the government and non‑government school sectors. Changes in overall funding by state and territory governments across years is affected by all these factors, including enrolment numbers and school size, location and staffing profiles. The National School Reform Agreement, which commenced on 1 January 2019, sets the state and territory funding requirements as a percentage of the Schooling Resourcing Standard.
User cost of capital (UCC)
The UCC is defined as the notional costs to governments of the funds tied up in capital (for example, land and buildings owned by government schools) used to provide services. The notional UCC makes explicit the opportunity cost of using government funds to own assets for the provision of services rather than investing elsewhere or retiring debt.
UCC is only reported for government schools (not non‑government schools). It is estimated at 8% of the value of non‑current physical assets, which are re‑valued over time.
Source: Australian Government Department of Education (2023) https://www.education.gov.au/quality-schools-package/resources/what-quality-schools-package-and-what-does-it-mean-my-school, accessed 8 October 2024.
| Terms | Definition |
|---|---|
| Aboriginal and Torres Strait Islander students | Students are considered to be Aboriginal or Torres Strait Islander origin if they identify as being an Aboriginal or Torres Strait Islander or from an Aboriginal and Torres Strait Islander background. Administrative processes for determining Indigenous status vary across jurisdictions. |
| Apparent retention rate | ‘Apparent’ rates are calculated using aggregate student data and have been developed to provide indicative measurements. These rates are not the ‘actual’ rate that would result from direct measurement of the movement of each individual student. This statistic is an indicative measure of the proportion of a cohort of full-time or full-time equivalent (FTE) students that move from one grade to the next based on an expected rate of progression of one grade per year. The Year level of commencement of secondary school varies across states and territories and over time. |
| Comparability | Data is considered comparable if (subject to caveats) they can be used to inform an assessment of comparative performance. Typically, data is considered comparable when they are collected in the same way and in accordance with the same definitions. For comparable indicators or measures, significant differences in reported results allow an assessment of differences in performance, rather than being the result of anomalies in the data. |
| Completeness | Data is considered complete if all required data is available for all jurisdictions that provide the service. |
| Confidence interval | A confidence interval is a specified interval, with the sample statistic at the centre, within which the corresponding population value can be said to lie with a given level of confidence (section 2). |
| Confidence intervals (for NAPLAN and NAP sample) | The NAPLAN and NAP sample confidence intervals are calculated by ACARA and take into account two factors:
Estimates of sampling and measurement errors are combined to obtain final standard errors and confidence intervals to determine statistical significance of mean differences and percentage differences in NAPLAN and NAP sample performance within a report year. For analysing difference across years, a further source of error needs to be accounted for:
To evaluate statistical significance of mean and percentage differences between years, ACARA tests the change between years taking into account the equating, sampling and measurement errors. However, the equating error is not represented within the reported confidence interval. |
| Foundation year (pre-Year 1) | The first year of primary school. Naming conventions for the foundation year differ between states and territories. Foundation year is known as:
|
| Full-time equivalent student | A measure used to indicate the number of students based on their total workload undertaken, as a proportion of a full-time workload. The FTE of a full-time student is 1.0. |
| Full-time student | A person who satisfies the definition of a student and is based on a minimum workload required to ensure that a student could complete a given Year level in a single calendar year. The definition of full-time student varies across jurisdictions. |
| Geographic classification (ASGS) | From 2016, Student remoteness is based on the Australian Statistical Geography Standard (ASGS) Remoteness Structure. The extended version of the Accessibility/Remoteness Index of Australia (ARIA+), developed by the University of Adelaide, is the standard ABS‑endorsed measure of remoteness on ABS postal areas. Student remoteness (ARIA+) regions use the same ARIA+ ranges as the ABS remoteness areas and are therefore an approximation of the ABS remoteness areas. For more details of ARIA+ refer to https://www.abs.gov.au/statistics/standards/australian-statistical-geography-standard-asgs-edition-3/jul2021-jun2026/remoteness-structure The remoteness categories are:
Geographic classifications prior to 2016 are based on the Ministerial Council for Education, Early Childhood Development and Youth Affairs (MCEECDYA) standard. Data is not directly comparable. (The exception is Census and survey data which were already using the ASGS, and prior to that the Australian Standard Geographic Classification). |
| Geographic classification (MCEECDYA) | Prior to 2016, Geographic categorisation is based on the agreed MCEECDYA Geographic Location Classification which, at the highest level, divides Australia into three zones (the metropolitan, provincial and remote zones).
|
| In‑school expenditure | Costs relating directly to schools. Staff, for example, are categorised as being either in‑school or out‑of‑school. They are categorised as in‑school if they usually spend more than half of their time actively engaged in duties at one or more schools or ancillary education establishments. In‑school employee related expenses, for example, represent all salaries, wages awards, allowances and related on costs paid to in‑school staff. |
| Low socio-educational background | Students in the lowest quartile of the Index of Community Socio-Educational Advantage (ICSEA). The ICSEA is a student level score constructed by ACARA from information (obtained from school enrolment records) relating to parents’ occupation, school education, and non‑school education. |
| Out‑of‑school expenditure | Costs relating indirectly to schools. Refer to ‘in‑school expenditure’. |
| Pre‑year 1 | Refer to ‘foundation year’. |
| Part-time student | A student undertaking a workload less than that specified as being full-time in the jurisdiction. |
| Real expenditure | Nominal expenditure adjusted for changes in prices, using the General Government Final Consumption Expenditure chain price deflator and expressed in terms of final year prices. |
| School | A school is an education establishment which satisfies all of the following criteria.
|
| Science literacy | Science literacy and scientific literacy: the application of broad conceptual understandings of science to make sense of the world, understand natural phenomena, and interpret media reports about scientific issues. It also includes asking investigable questions, conducting investigations, collecting and interpreting data and making decisions. |
| Socio-economic status | As identified in footnotes to specific tables. |
| Socio‑educational background | Refer to ‘Low socio‑educational background’. |
| Source of income | In this chapter, income from either the Australian Government or state and territory governments. Australian Government expenditure is derived from specific purpose payments (current and capital) for schools. This funding indicates the level of monies allocated, not necessarily the level of expenditure incurred in any given financial year. The data therefore provide only a broad indication of the level of Australian Government funding. |
| Special school | A special school satisfies the definition of a school and enrols students with one or more of the following characteristics:
|
| Student‑to‑staff ratios | The number of FTE students per FTE teaching staff. Students at special schools are allocated to primary and secondary. The FTE of staff includes those who are generally active in schools and ancillary education establishments. |
| Student | A person who is formally enrolled or registered at a school, and active in a primary, secondary and/or special education program at that school. Students at special schools are allocated to primary and secondary on the basis of their actual grade (if assigned); whether or not they are receiving primary or secondary curriculum instruction; or, as a last resort, whether they are of primary or secondary school age. |
| Students with disability | Students are counted in the Nationally Consistent Collection of Data on School Students with Disability where:
The DDA provides a broad definition of disability. The DDA covers individuals with disability, associates of a person with a disability, people who do not have a disability but who may face disability discrimination in the future, people who are not in fact impaired in functioning but treated as impaired, and people with conditions such as obesity, mild allergies or physical sensitivities, and those who wear glasses. |
| Teaching staff | Teaching staff are defined as those who spend the majority of their time in contact with students. They support students either by direct class contact or on an individual basis, and are engaged to impart school curriculum. Teaching staff include principals, deputy principals, campus principals and senior teachers mainly involved in administration. Teacher aides and assistants, and specialist support staff are excluded, except assistant teachers working in homeland learning centres and community schools in the Northern Territory. |
| Ungraded student | A student in ungraded classes who cannot readily be allocated to a year of education. These students are included as either ungraded primary or ungraded secondary, according to the typical age level in each jurisdiction. |
| VET in Schools | VET in Schools refers to nationally recognised VET qualifications or accredited courses undertaken by school students as part of the senior secondary certificate. The training that students receive reflects specific industry competency standards and is delivered by an external Registered Training Organisation (RTO), the school or school sector as an RTO or the school in partnership with an RTO. VET courses may require structured work placements and may be undertaken as a school‑based apprenticeship or traineeship. |
ABS (Australian Bureau of Statistics) 2025, Schools, https://www.abs.gov.au/statistics/people/education/schools/2024 (accessed 1 April 2025).
ACARA (Australian Curriculum, Assessment and Reporting Authority) 2023, NAPLAN national results, https://www.acara.edu.au/reporting/national-report-on-schooling-in-australia/naplan-national-results (accessed 8 October 2024).
ACER (Australian Council for Educational Research) 2023, Progress in International Reading Literacy Study: Australia’s results from PIRLS 2021, https://doi.org/10.37517/978-1-74286-693-2 (accessed 8 October 2024).
Boon, HJ 2011, ‘Raising the bar: ethics education for quality teachers’, Australian Journal of Teacher Education, 36:76–93.
COAG 2018, National School Reform Agreement, https://federalfinancialrelations.gov.au/agreements/national-schools-reform-agreement (accessed 8 October 2024).
—— 2009, National Partnership Agreement on Youth Attainment and Transitions, https://federalfinancialrelations.gov.au/agreements/national-partnership-agreement-youth-attainment-and-transitions (accessed 8 October 2024).
De Bortoli, L, Underwood, C and Thomson, S 2003, PISA 2022, Reporting Australia’s results, Volume I: Student performance and equity in education, ACER, https://doi.org/10.37517/978-1-74286-725-0 (accessed 8 October 2024).
EC (Education Council) 2019, Alice Springs (Mparntwe) Education Declaration, https://www.education.gov.au/alice-springs-mparntwe-education-declaration/resources/alice-springs-mparntwe-education-declaration (accessed 8 October 2024).
Fredricks, J, Blumenfeld, P and Paris, A 2004, ‘School Engagement: Potential of the Concept, State of the Evidence’, Review of Educational Research, 74(1):59–109.
Hattie, JA 2009, Visible Learning: A Synthesis of Over 800 Meta‑analyses Relating to Achievement, Routledge.
Hancock, KJ, Shepherd, CCJ, Lawrence, D and Zubrick, SR 2013, Student attendance and educational outcomes: Every day counts, Report for the Department of Education, Employment and Workplace Relations.
NCVER (National Centre for Vocational Education Research) 2024, VET in Schools 2023, https://www.ncver.edu.au/research-and-statistics/publications/all-publications/vet-in-schools-2023 (accessed 6 October 2024).
PC (Productivity Commission) 2012, Schools Workforce, Research Report.
PM&C (Department of the Prime Minister and Cabinet) 2014, Roles and responsibilities in education, Part A: Early Childhood and Schools, Reform of Federation White Issues Paper 4.
UNESCO‑IBE (United Nations Education Scientific and Cultural Organisation – International Bureau of Education) 2016, What Makes a Quality Curriculum? ![]() http://unesdoc.unesco.org/images/0024/002439/243975e.pdf (accessed 8 October 2024).
http://unesdoc.unesco.org/images/0024/002439/243975e.pdf (accessed 8 October 2024).
Wernert, N, Schmid, M, and Rodrigues, S 2024, TIMSS 2023 Australia, Volume I: Student performance. Australian Council for Educational Research, https://doi.org/10.37517/978-1-74286-755-7 (accessed 4 December 2024).
A PDF of Part B Child care, education and training can be downloaded from the Part B sector overview page. Current as at 11 February 2025.

TIMSS
Nationally in 2023, the proportion of students who performed at or above the national proficient standard for the TIMSS:
In 2023, Australia’s performance was higher than the TIMSS International average in both subjects, for both year levels (Wernert, Schmid and Rodrigues 2024).